Setup guide
Connect athletedata to Lovable
Add athletedata as a custom MCP connector in Lovable, so the Lovable Agent can read your training data while it builds.
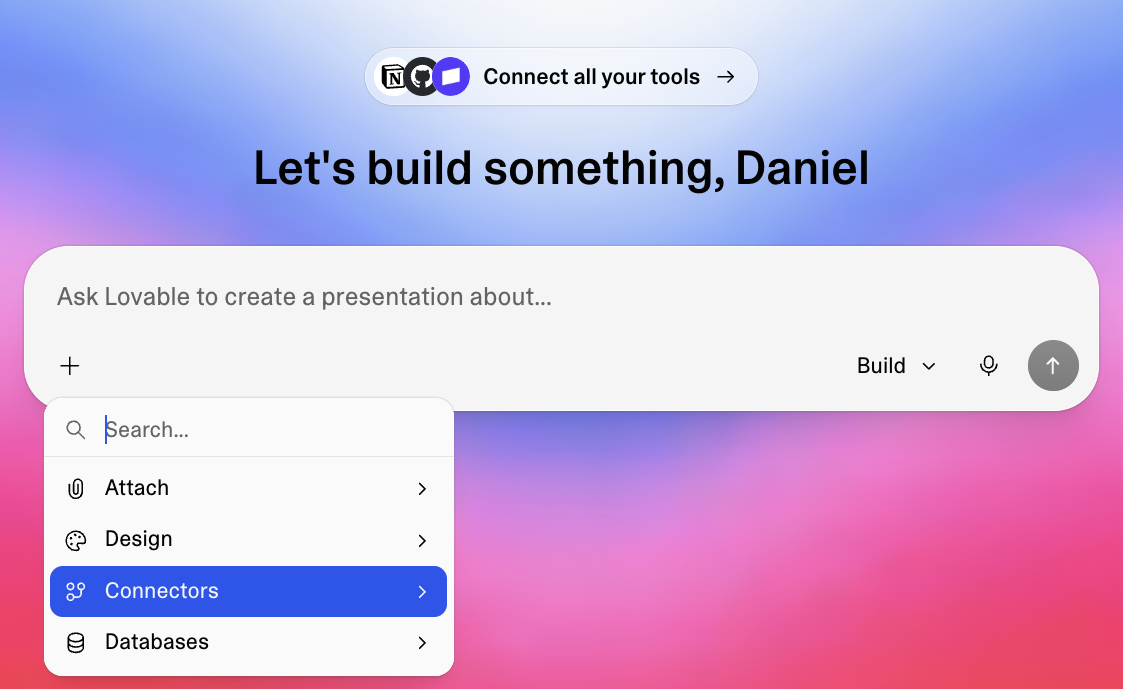
Open the Connectors menu
In the Lovable builder, click the + button in the chat composer, then choose Connectors from the menu.
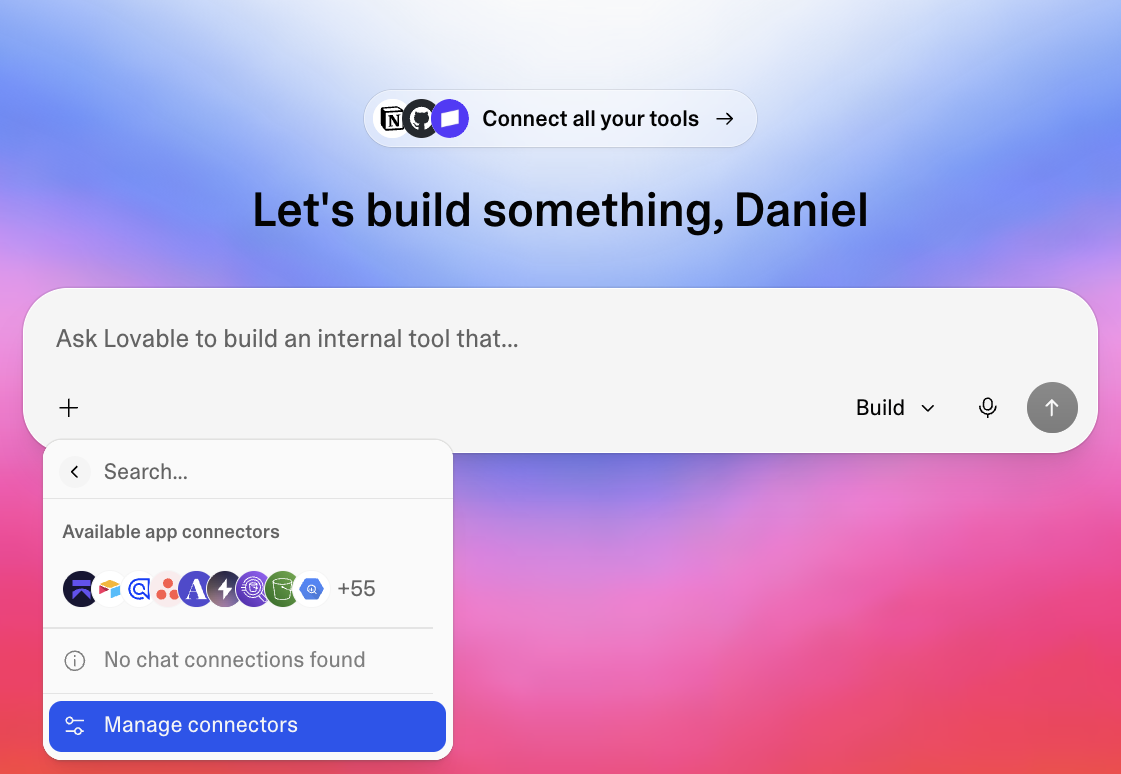
Click 'Manage connectors'
Hover Connectors to see your connected apps, then click Manage connectors at the bottom to add a new one.
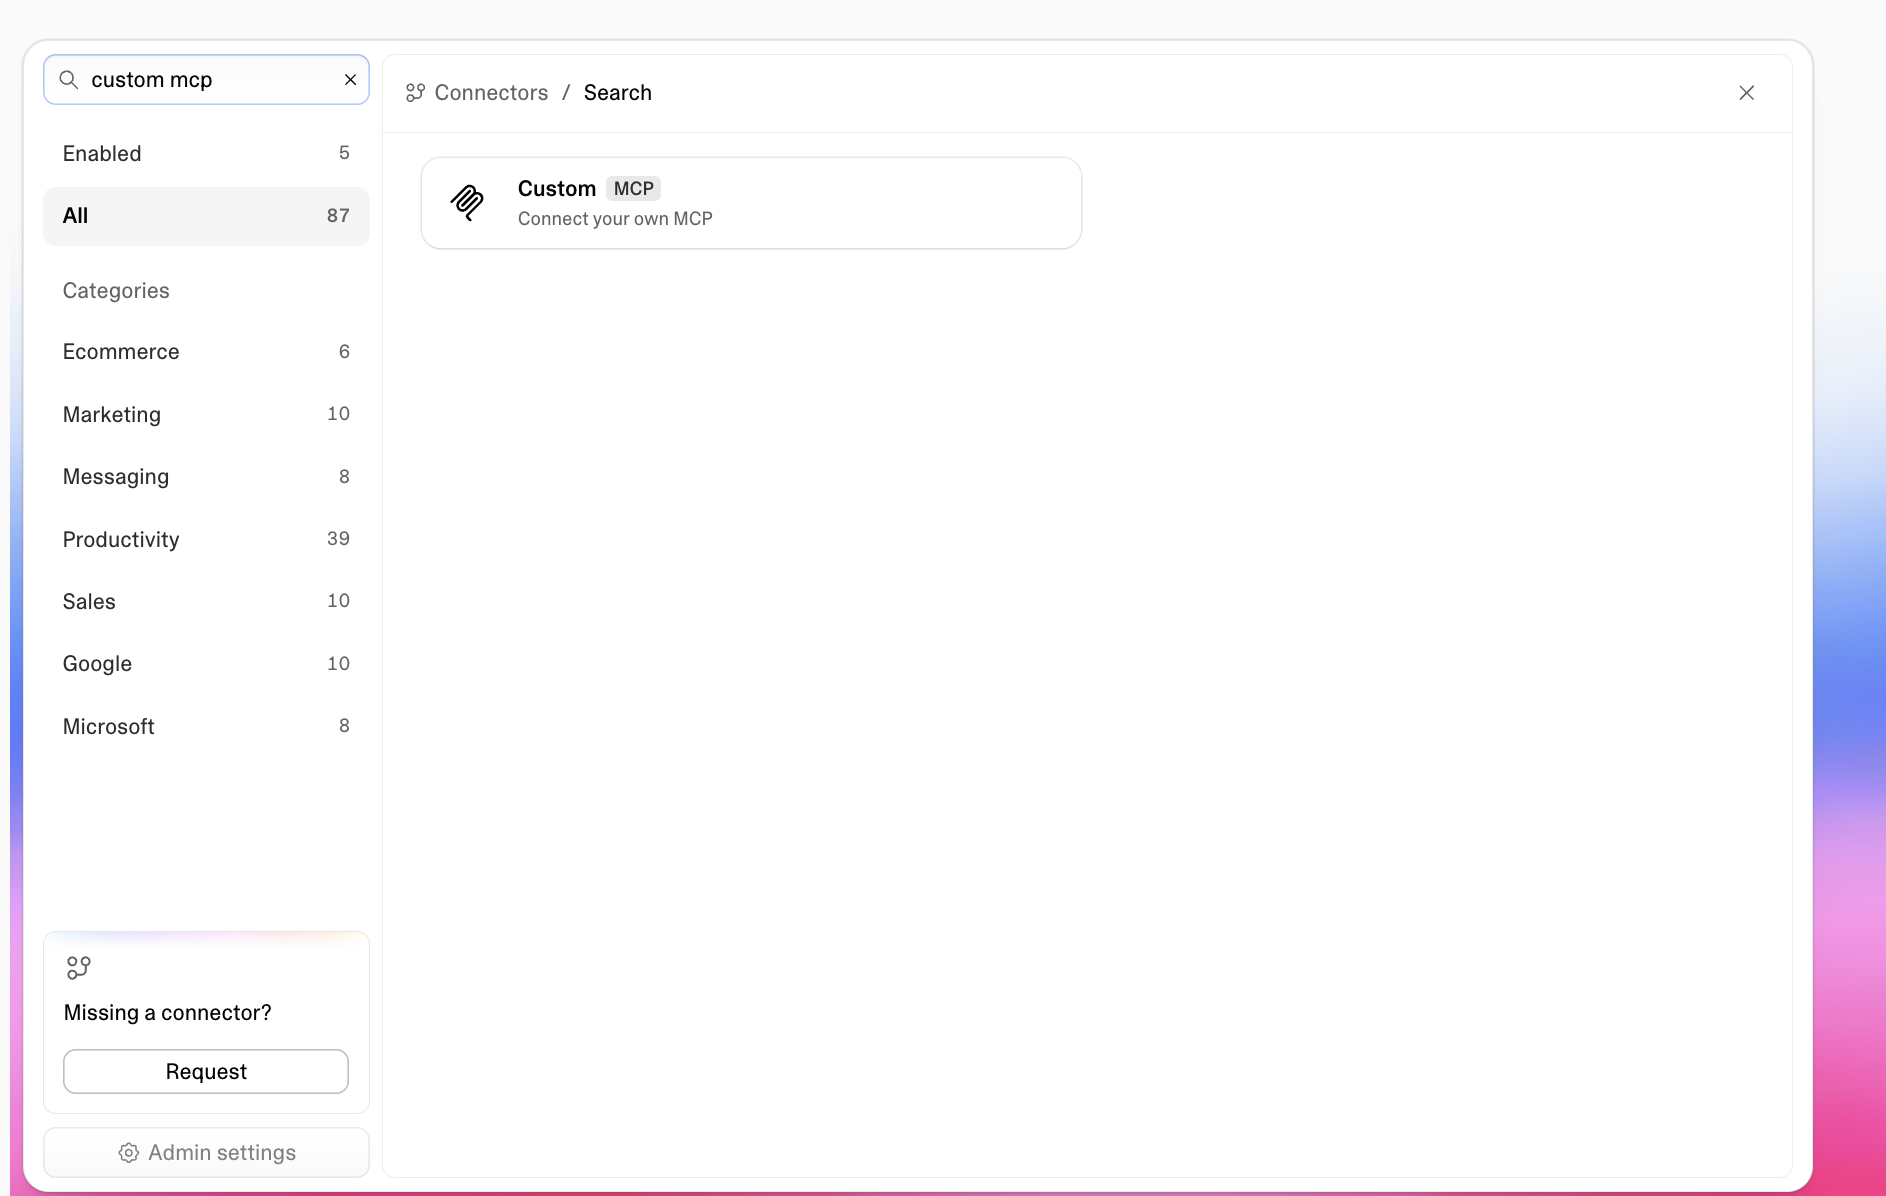
Find the Custom MCP connector
Search for custom mcp and click the Custom MCP card ("Connect your own MCP").
Add the athletedata server
Fill in the "Add MCP server" form:
- Server name:
athletedata - Server URL: paste your full MCP URL from the Copy MCP URL button on your dashboard. It already includes your API key and looks like
https://mcp.athletedata.health/mcp?apiKey=sk_soma_... - Authentication: choose No authentication - your key is already in the URL.
Then click Add server.
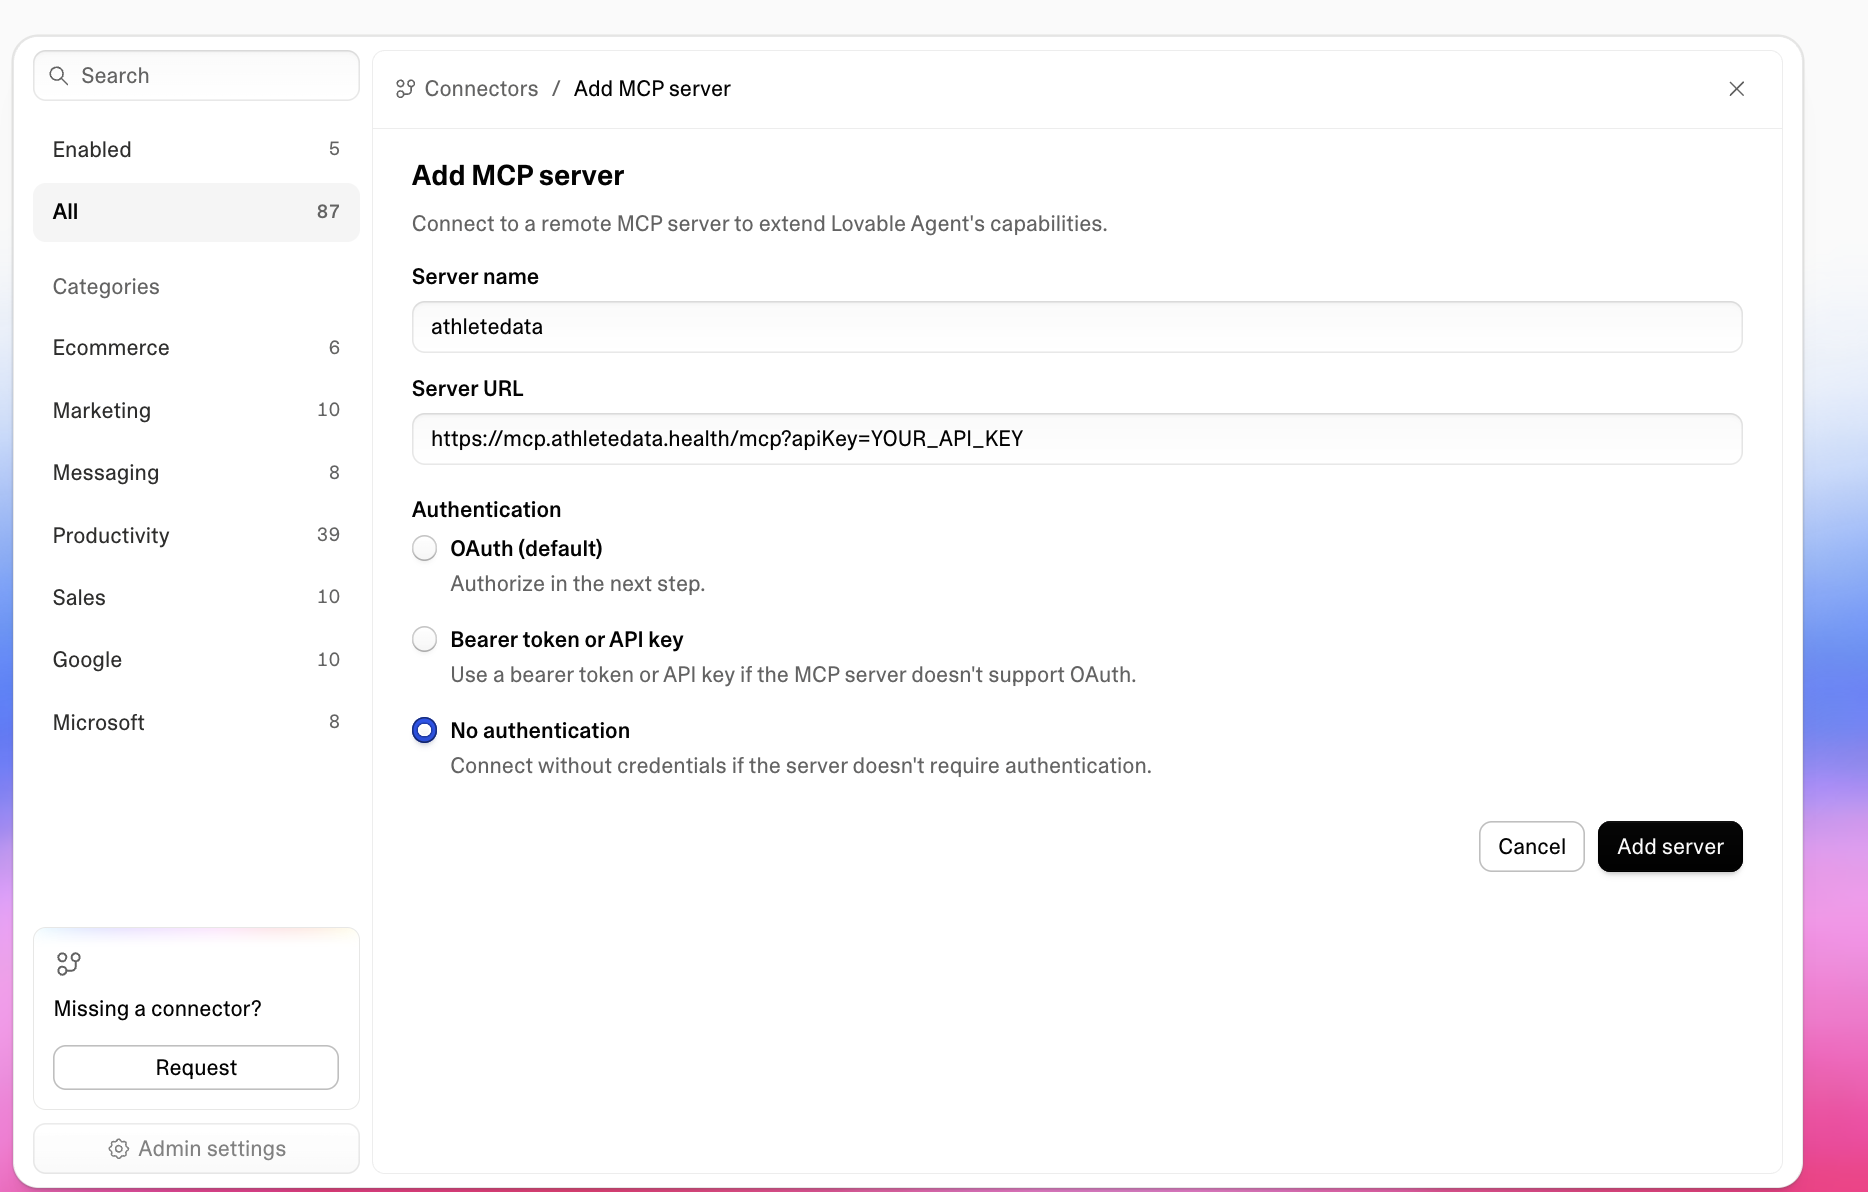
?apiKey= part), so pick No authentication. You don't need the npx / mcp-remote setup that desktop apps use.Start building
Now build something with your data. The athletedata connector shows up in your chat connectors, and the Lovable Agent calls the tools automatically while it builds - pulling your real numbers so you get a finished page with your actual data, not placeholders.
Copy one of these to start, then tweak:
Build a shareable "My Year in Sport" recap - one scrollable page I can screenshot and post. Use my connected athletedata MCP to pull this year's real numbers: total distance, total elevation, total moving time, number of activities, my biggest training week, my longest run and ride, and my 5 hardest sessions. Use the real values, never placeholder data. Lay it out like a Spotify Wrapped story: a sequence of full-screen sections that each reveal one big headline stat, ending with a "top 5 sessions" summary card. Style: bold and celebratory. Dark background, vibrant gradient accents, oversized display typography, generous spacing, rounded cards, and subtle fade-in on scroll. Make it fully responsive and great as a phone screenshot.
Build a personal training dashboard for my last 90 days. Use my connected athletedata MCP to pull real data: my fitness, fatigue and form (CTL/ATL/TSB), weekly training hours by sport, resting HR and HRV trends, and my recent activities. Use real values, not placeholders. Layout: a top row of summary stat cards (current fitness, weekly hours, resting HR, HRV), then line charts for fitness vs fatigue and HRV over time, then a sortable table of recent activities. Style: clean and minimal. Light theme, lots of whitespace, a neutral palette with one accent color, a modern sans-serif, rounded cards with soft shadows. Fully responsive, with clear loading and empty states.
Build a race-day countdown page for my next race. Use my connected athletedata MCP to pull my current fitness (CTL) and recent readiness. If you don't already know my race name and date, ask me. Use real values. Sections: a large live countdown to race day, my current fitness vs my goal, a taper-week checklist, and today's readiness score with a one-line interpretation. Style: focused and motivating. Dark hero with a single bold accent color, oversized countdown numerals, minimal supporting cards, a calm and premium feel. Fully responsive.
Not working?
- Make sure you picked No authentication - the OAuth default won't work, since athletedata authenticates with the key in the URL.
- Make sure the URL you pasted contains
?apiKey=(the Copy MCP URL button adds it for you). - Make sure your athletedata subscription is active - check your billing page.
- Connect at least one app (Garmin, WHOOP, Oura, etc.) on the integrations page - otherwise the tools have nothing to query.
- Stuck? Email team@athletedata.health and we'll help directly.
New to athletedata?
athletedata pulls your training, sleep and recovery out of 35 apps - Garmin, WHOOP, Oura, Apple Health, Hevy and the rest of your stack - and keeps it in one place. This guide is how you point the AI you already use at it. You just need an account first.
Works with Claude, ChatGPT, Cursor, Perplexity and Lovable. Cancel anytime.